

200+
Tech. Professionals
310+
Clients
2,150+
Projects Delivered
10+
Years of Experience
97%
Client Retention
5.0/5
Clutch Rating
Data Analytics & Visualization
Make Your Business Data Easier to Understand
Businesses collect data from sales, customer interactions, finance, operations, and other systems. But when information sits in separate applications or reports use different definitions, it can be difficult to get a clear view of performance.
IT IDOL Technologies helps businesses organize, analyze, and present data in ways that support day-to-day decisions. We can help define reporting requirements, analyze business performance, build interactive dashboards, and connect relevant data sources for more consistent reporting.
Whether you need a sales dashboard, operational reports, management-level KPIs, or a clearer view of business trends, we work with your requirements and existing systems to develop an approach that fits your team.
Our Data Analytics & Visualization Services
Reporting and Analytics Built Around Your Business Needs
Useful reporting starts with knowing which information your teams need and how they will use it. Our data analytics and visualization services help you define relevant metrics, organize data from available sources, and present business information through reports and dashboards that support day-to-day decisions.
Business Intelligence Consulting
Review reporting requirements, business questions, and available data to identify the metrics and analytical views that will help teams monitor performance.
Interactive Dashboard Development
Build dashboards that bring relevant metrics, trends, and comparisons into one place, with filters and views suited to different users.
Data Visualization
Present complex datasets through appropriate charts, graphs, tables, and visual summaries so users can understand patterns and comparisons more easily.
Sales and Revenue Analytics
Develop reports and dashboards for sales performance, revenue trends, pipeline activity, target tracking, and other relevant commercial metrics.
Financial and Operational Reporting
Organize financial or operational information into reports that help teams review costs, performance, workload, and progress against defined measures.
KPI Design and Performance Tracking
Help define meaningful key performance indicators, calculation rules, reporting frequency, and dashboard views aligned with business objectives.
Data Integration for Reporting
Connect relevant data sources through available interfaces and integration methods so reports can draw on information from multiple business systems.
Reporting Automation
Reduce repetitive reporting work by automating supported data preparation, refresh, and report-generation tasks where the underlying systems allow it.
Data Analysis and Trend Identification
Analyze historical and current data to investigate changes, compare performance, and identify patterns that may need further attention.
Dashboard Maintenance and Improvement
Update existing dashboards, improve report usability, refine metrics, and address changing business and reporting requirements.
Business Applications
Get a Clearer View of Business Performance
When business information is spread across systems or reports, it can be difficult to see what is working and where attention is needed. We help bring relevant data together and present it in useful reports and dashboards, giving teams a clearer view of performance across sales, finance, marketing, and operations.
Sales Performance Dashboards
Track sales activity, revenue, targets, conversion rates, and pipeline performance through reports designed around your sales process.
Executive and Management Dashboards
Bring key business measures into a consolidated view so decision-makers can review performance without switching between multiple reports.
Financial Performance Reporting
Analyze revenue, expenses, margins, and other available financial measures to help teams review results and identify areas requiring attention.
Marketing Campaign Analytics
Bring together relevant campaign and lead data to review traffic, engagement, conversions, and campaign performance across supported platforms.
Customer and Product Analytics
Analyze customer activity, purchasing patterns, product performance, and engagement data to help teams understand what is happening across their business.
Operational Performance Tracking
Monitor relevant measures such as order volumes, processing times, service levels, and resource utilization to support operational reviews.
Inventory and Supply Chain Reporting
Create reports that help teams review stock levels, order activity, inventory movement, and other available supply chain measures.
Multi-System Business Reporting
Combine data from supported CRM, ERP, finance, and operational systems to provide a more consistent view of business performance.
Our Work
Data Analytics Projects Built Around Business Needs
Showcase projects that demonstrate how analytics, reporting, or visualization helped a business understand its performance or improve access to information. Each case study should explain the original reporting challenge, the solution delivered, and the verified outcome.
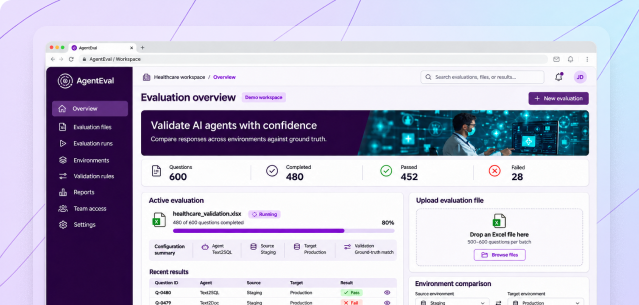
AI Agent Testing & Evaluation
A platform for testing and evaluating AI agents across different tasks and performance criteria.
View Project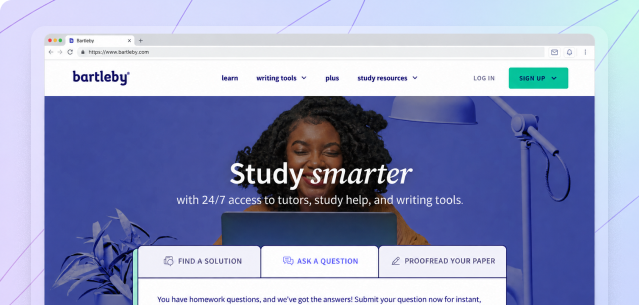
AI-Assisted Content Quality Platform
An online education platform that uses AI to review content, check quality, and support content editing.
View Project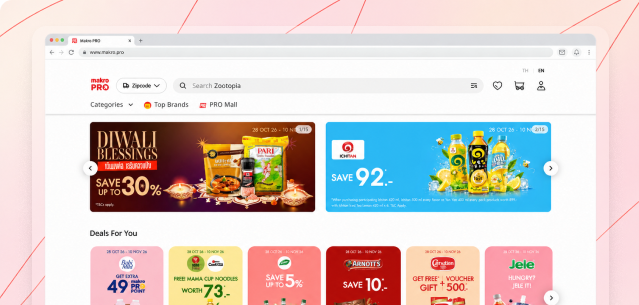
Digital Commerce Platform for Makro PRO
A digital commerce platform developed to support Makro PRO's online shopping and business operations.
View Project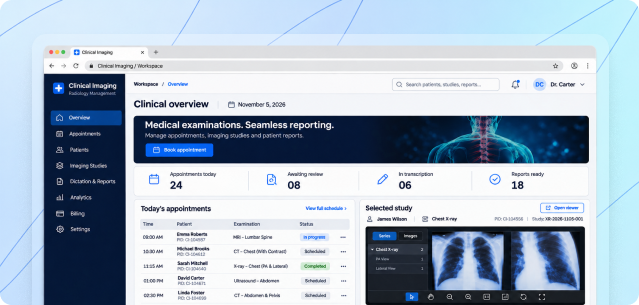
Radiology Management & Reporting Software
A medical software platform for managing examination appointments, radiology reports, and reporting workflows.
View ProjectOur Development Process
From Reporting Requirements to Useful Dashboards
We start by understanding what your teams need to measure, which data sources are available, and what decisions the reports should support. From defining KPIs and preparing data to developing dashboards and validating results, our process keeps the reporting solution aligned with your business requirements.
Business Requirements and Discovery
We discuss the decisions your teams need to make, the reports they currently use, and the metrics they need to track.
Data Source and Quality Assessment
We review the available data sources, data definitions, quality, access, and refresh requirements to understand what the reports can reliably show.
KPI and Reporting Design
We define the relevant metrics, calculation rules, filters, reporting periods, and dashboard views based on your business requirements.
Data Preparation and Integration
We prepare the required data and connect relevant systems through suitable methods, based on available interfaces and the agreed scope.
Dashboard and Visualization Development
We build the dashboards, charts, tables, and reports, with layouts and filters suited to the intended users and their reporting needs.
Testing and Validation
We check calculations, compare results with source data, verify filters and reporting periods, and confirm that the dashboards present information as expected.
Deployment and Ongoing Improvement
We prepare the reports for use and can support maintenance, new metrics, dashboard improvements, and changes to reporting requirements.
Technology & Expertise
Evaluate the Right Technology for Your Analytics Needs
Analytics and visualization technology decisions should follow your reporting requirements, data sources, user needs, refresh frequency, and operating budget. Our team can assess suitable options and help identify an approach that fits your business and existing systems.
Business Intelligence & Reporting
Data Visualization
Data Analysis & Preparation
Analytics & Data Modeling
Databases & Data Sources
Data Integration & Refresh
Cloud & Infrastructure
Need a Team to Build Your Analytics Solution?
IT IDOL Technologies provides developers across 30+ technologies. Whether you need interactive dashboards, automated reports, data integrations, or additional technical capacity for an analytics project, you can work with our team to develop the solution or add specific technical skills to your existing team.
Why Clients Work With Us
A Technology Partner You Can Rely On
Choosing a technology partner is about more than finding people who can write code. You need a team that understands your requirements, communicates clearly, and stays accountable through delivery.
CMMI Level 5
A structured approach to software development and delivery.
Experienced Technology Teams
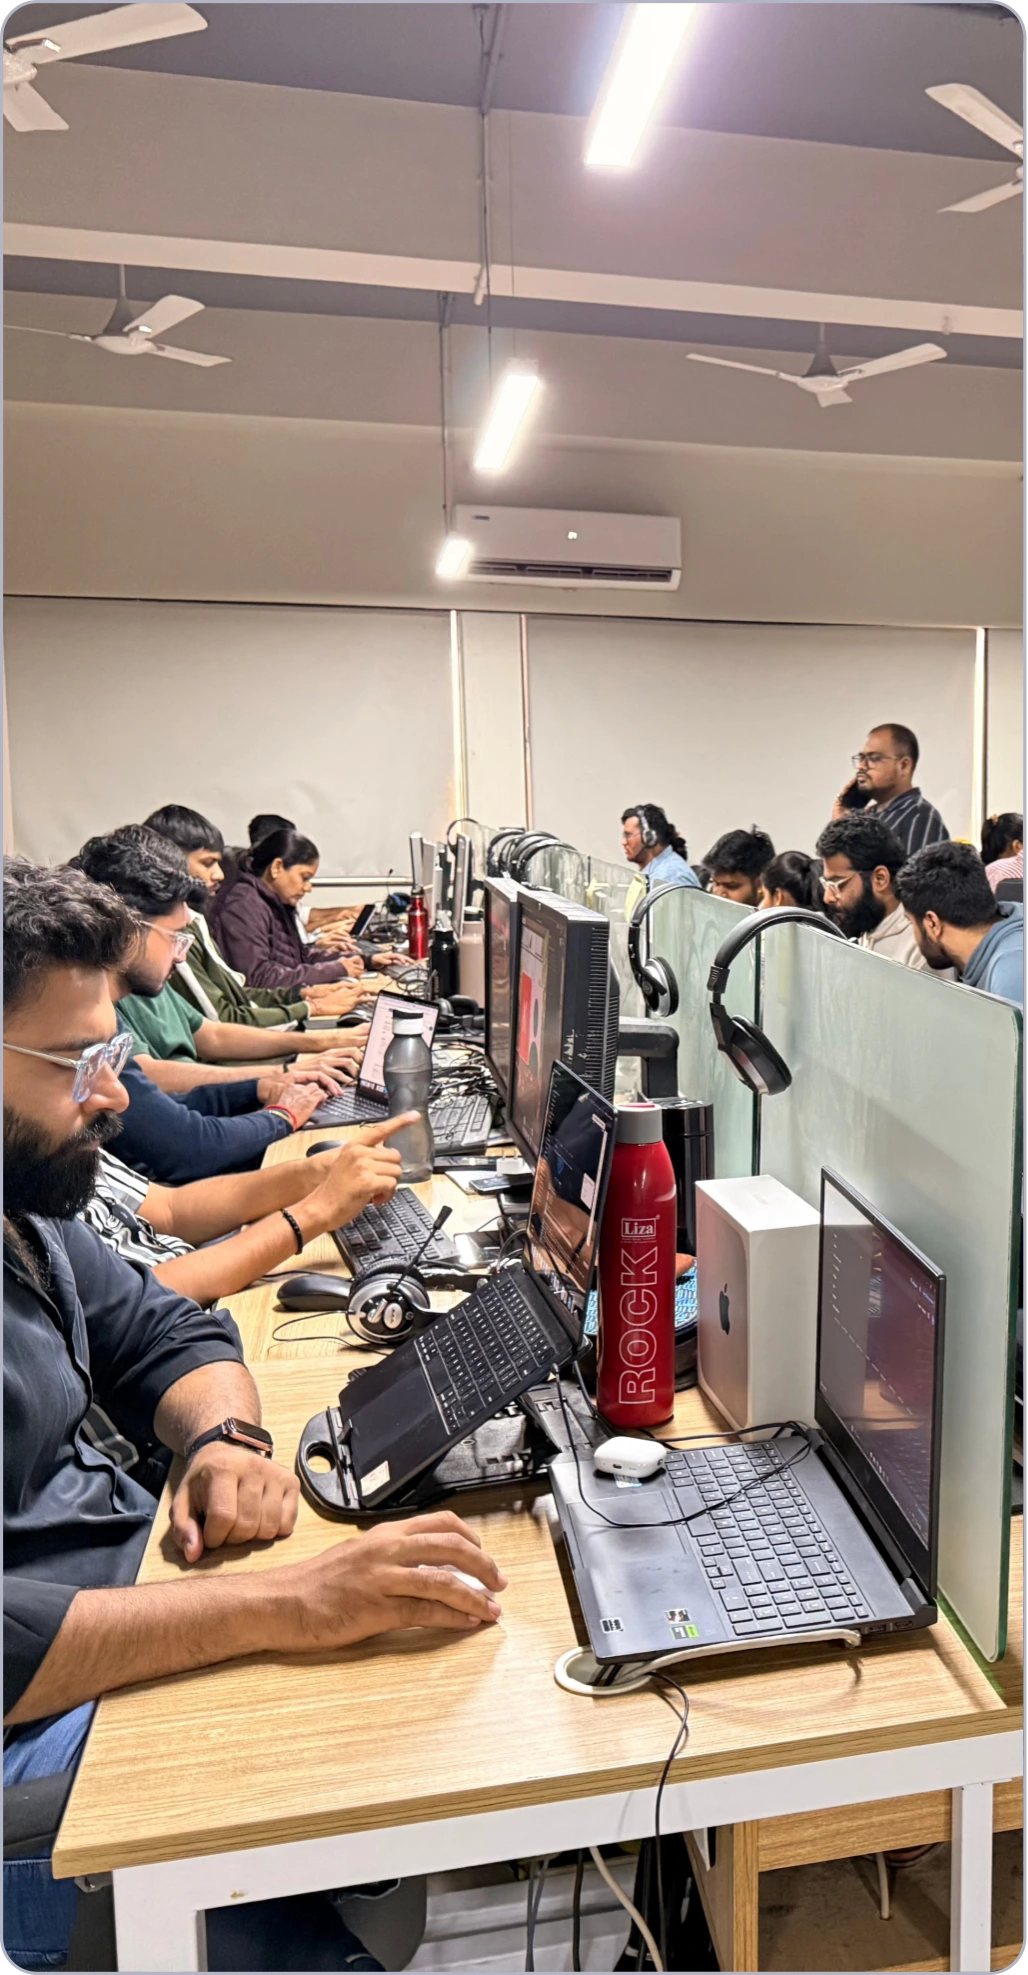
Our 200+ technology professionals cover software development, AI, data, mobile, web, and other technology disciplines.
Flexible Engagement
Choose an engagement model that fits your project, whether you need a complete development team or additional technical capacity.
Global Client Base
Working with businesses across the US, UK, India, Canada, UAE, Singapore, and other global markets
NDA & Code Confidentiality
Your project information and source code are handled under clear confidentiality and NDA terms.
Ways to Work With Us
Choose the Engagement Model That Fits Your Project
Not every project needs the same team structure or contract model. We offer different ways to work together depending on your scope, timeline, and level of involvement.
Fixed Price
Best for analytics projects with clearly defined reporting requirements, metrics, dashboards, and deliverables.
Time & Materials
A flexible option when reporting needs evolve as users review dashboards, explore data, or request additional analysis.
Dedicated Team
A dedicated group of technology professionals working as an extension of your team on analytics, visualization, and reporting initiatives.
Strategic Partnership
Long-term technology support for businesses that need ongoing help maintaining and expanding their analytics and reporting capabilities.
Frequently Asked Questions
Common Questions About Data Analytics & Visualization
Video Testimonials
What Our Clients Say About Working With Us
Hear directly from clients about their experience working with IT IDOL Technologies, including communication, technical delivery, project management, and ongoing support.

AI Enterprise

Entertainment Industry Canada

IT Industry Client India

Construction Industry Client Hongkong

Aplha Obs LLP

Girnar Software

Only Goods

Pure Technologies

ellowtech
Need a Clearer View of Your Business Data?
Whether you want to build a management dashboard, bring data from multiple systems together, automate reporting, or understand business performance more clearly, let’s discuss your reporting needs and the data available.